I thought learning about DC’s Covid-19 response would help me regain the sense of control I lost in March. I’d been inside for three months, court closures had made my day job as a paralegal largely irrelevant, and DC’s Covid-19 dashboard updated daily around 10:30 AM. I started waiting in bed every morning until the latest infections and deaths were posted, in some version of the strategy people use to combat a fear of flying: stay awake for the entire flight, carefully watching the wing to ensure the plane doesn’t crash.
My coping mechanism worked well enough until June 22, when Mayor Muriel Bowser announced that the District would enter its second phase of reopening. The problem was, I knew DC had not met the metrics to do so. I had proof Bowser manipulated Covid-19 data, and local reporters used my frantically tweeted research to report on the discrepancy between DC’s real numbers and its publicly touted progress. The city went ahead and reopened anyway.
The facile explanation for DC’s data manipulation is widely accepted on the left: Bowser rushed reopening because she prioritized business owners over vulnerable residents, the economy over human life. This line of thinking is broadly true, but the driving force behind rushed reopenings across the country is more complicated. No one was prepared for the financial impact of Covid-19, and states had only two options to avoid massive budget shortfalls: federal aid, or consumer spending. Since the former was unlikely to materialize, states needed to jumpstart the latter. Pulling back the curtain on the inadequate state budget system was unlikely to motivate thirty-somethings to go back to bars and restaurants. But making reopening seem safe (or never shutting down in the first place) was an easy way to keep people spending, business interests happy, and increasingly vital social services funded.
Eight months into the pandemic, it’s obvious that this strategy failed to stop the spread of Covid-19. States are now only aiming to contain the inevitable wave of infections as cities reopen, the weather turns colder, and flu season starts. Without significant federal support, they will fail again.
By March 16, forty-eight states and DC had issued half-hearted state-of-emergency declarations — but these had little effect on transmission of the virus, which had already been spreading across the country, undetected, for over a month. As the first wave of deadly outbreaks hit, states instituted comically asynchronous stay-at-home orders. While Californians were told to remain inside starting on March 19, their neighbors in Arizona and Nevada were free to continue on as normal until March 31. Philadelphia issued a citywide order on March 22, but Pennsylvania’s state order didn’t take effect until April 1. Of the forty-five states that ultimately issued stay-at-home orders, only eight shut down on the same day as a neighboring state: Oregon and Washington, Michigan and Indiana, Maryland and Virginia, and Georgia and Florida. Absent unified orders and enforcement, residents could easily evade hometown restrictions by crossing a border. Philly residents were driving to Delaware for booze long before Covid-19 closed Pennsylvania’s state-run liquor stores, and they continued to do so until state troopers started enforcing the Delaware Governor’s order in April.
Recent talk of “reopening” implies that the United States was shut down for a significant period of time, but most states lifted at least some restrictions within 40 days. In DC, less than a month after her stay-at-home order, Bowser convened the ReOpen DC Advisory Group. Led by Obama-era Ambassador Susan Rice and Bush-era DHS Secretary Michael Chertoff, every member was handpicked by Bowser, seemingly on the basis of personal loyalty. Chertoff’s primary experience with national emergencies was botching the federal response to Hurricane Katrina. Only two restaurateurs (celebrity chef José Andrés and woke entrepreneur Andy Shallal) were selected for the committee responsible for restaurants and food retailers; charter school advocates were on the education committee, but public school teachers and union representatives were not. Other members included an assortment of District developers and lobbyists, plus Bowser’s older brother Marvin.
The advisory group surveyed more than 17,000 District residents, held focus groups, and hosted a town hall before issuing a plan for which kinds of venues could reopen early (restaurant patios, tennis courts) and which should stay closed until the virus was under control (bars, communal pools). Their recommendations laid out how DC should reopen, but said little about when to do so, beyond asking city officials to consider issuing “clear communication regarding gating criteria for reopening and pulling back.” After the group’s plan was released, DC cut its previously-announced list of 11 reopening metrics down to six; Bowser repeatedly denied that the removed criteria had ever been under consideration.
One of the surviving metrics was the CDC-recommended 14-day decline in recorded cases. The number of new cases indicates how far the virus has spread in an area, and foreshadows how many hospitalizations and deaths will occur in the following weeks. The benchmark appeared in state reopening plans but was difficult to achieve in the spring, when restrictions had only been implemented a month or two prior. Cases kept rising and, by May, only a few states had experienced close to a 14-day decline. Most that hadn’t met the goal quietly abandoned it, but DC had a better solution: redefining it. DC’s Health Department clarified that it was now looking for a 14-day decline in “community spread” — excluding infections in “congregate settings” like jails, shelters, and nursing homes. DC officials presented the change as a routine improvement in data reporting. This metric was more accurate, DC Health claimed, as it charted the number of infectious people out and about on a particular date rather than the total number of positive test results.
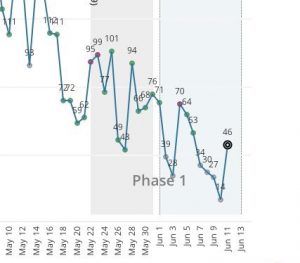
Despite the sharp increase in daily number of new infections, DC kept reporting a decline in community spread. This was because the metric tracked infectious people by graphing when their symptoms began; the date of symptom onset was determined by interviews conducted days (or weeks) after a positive test result came in. The delay rendered the metric absurdly volatile: on July 14, DC reported only 24 infectious people. By July 20, DC had raised that estimate for the same days to 62. The most recent seven-to-nine days of community spread data always displayed a decline, not because cases were actually decreasing but because DC hadn’t completed the contact tracing necessary to confirm cases were going up. By June 19, an undeterred Bowser announced that DC had met its goal of fourteen days of decline in community spread, and would be ready for the next stage of reopening three days later. The next day, a new spike was reported, which should have set the count back three days. But the data was quickly deleted from the public dashboard; a hastily cropped screenshot I’d tweeted is the only record, to my knowledge, that it had been posted at all.
Rachel Sadon of DCistspotted the deletion when comparing my tweet to the dashboard, but Bowser’s office refused to explain what happened. When asked about the deleted data at a press conference on June 22, Bowser almost claimed nothing had been removed. “Nothing was re-” she began, before correcting herself: “I don’t know what you’re referring to as being removed.” She confirmed there had been a spike but claimed reopening did not need to be delayed because DC had already met the metric. This was untrue. “We always know we can have different experiences with the data,” she said. Cases in DC doubled three weeks after reopening.
The infamous screenshot, courtesy of Allison Hrabar
I will admit that this is the point where I lost my mind. I submitted a FOIA request to DC Health asking for any written communication about data removal; a FOIA officer told me that the health department has no control over what is posted on the dashboard and suggested I ask the Mayor’s office. Over the course of multiple Saturdays, I crafted an Excel chart to track weekly changes in community spread. When I casually mentioned Covid-19 on a Zoom call with friends, there were audible groans and an impression of me talking about “the charts.” I developed an all-encompassing hunger for validation, rattling off statistics whenever someone mentioned the mayor, the virus, or the concept of socializing.
Despite my best efforts, inaccurate and misleading Covid-19 data is a nationwide problem. Virginia, Vermont, and Texas artificially inflated their testing capacity prior to reopening by combining the count of viral tests (the swab-up-your-nose variety) with the less-reliable antibody blood tests. Nevada dismissed an increase in cases as a side effect of expanded testing and lab delays in making its case for reopening casinos in May; it had its highest single-day infection growth within two-and-a-half weeks. Georgia, a deep-red state, adopted a community spread metric identical to DC’s. While DC’s received little media attention, Georgia’s was accurately flagged as an attempt to make the state appear as if it had moved past the peak of cases.
Still, DC’s deletion of unfavorable data was extreme. While some of the pressure on Bowser to shut down late and reopen early came from businesses hoping to stay afloat, DC’s lack of autonomy over its budget was a significant factor. Unlike the federal government, DC cannot issue debt and spend its way out of a crisis. Unlike states, DC must have its budget approved by Congress and the President. Congress can even dictate how we spend our reserves or generate revenue; when DC residents voted to legalize marijuana, Congress forbade taxing its sale. Unable to issue debt, tap into obvious new income sources, or even access the full CARES Act money that states received, DC could not give businesses and suddenly out-of-work residents the support they needed to get through a lengthy shutdown. Even though restaurants remained fully open until last call at brunch on March 15, DC was already projecting a $1.5 billion revenue shortfall by April.
States have slightly more control over the details of their budget than the District does, but it’s unlikely any of them could have met the level of spending required to mitigate shutdown losses without significant federal assistance. California is currently facing a $54 billion deficit, and already has relied on $10 billion in federal aid. $14 billion in additional federal aid is needed to prevent further budget cuts. In DC, the chief financial officer is assuming that at least some additional federal assistance will be approved, because the alternative would be “allowing the economy to go into an even deeper recession.” But it’s unlikely his optimism will pay off, as Trump continues to abruptly call off and restart stimulus negotiations. Trump “personally came up with the strategy of blaming the states,” according to Max Kennedy, Jr., who worked on the federal Covid-19 task force. The Trump administration abdicated leadership early on, allowing states to battle it out over scarce PPE and putting severe limitations on how they could use the aid they did receive. Faced with massive revenue shortfalls, states chose to accept the small gains of a hurried reopening rather than fighting for the federal resources necessary to bail out workers and business owners.
If the pandemic had lasted only a month or two, bargaining for more death in exchange for more revenue might have worked. Stay-at-home orders had a dramatic impact on local economies: the US had an average five percent decline in GDP in the first quarter of 2020, but the economies of states that never issued stay-at-home orders were hit less hard. North Dakota, South Dakota, and Nebraska only saw declines of 1.3-2.6 percent; Iowa and Oklahoma kept their declines under four percent. Arkansas’s five percent decline was the largest among the stay-at-home holdouts but on par with declines in the rest of the country. The obvious trade-off for a relatively better GDP is a significantly worse infection rate: North Dakota and South Dakota have the highest rates of Covid in the country. Iowa, Arkansas, Oklahoma, and Nebraska all appear in the top ten.
States that shut down saved lives, but they will be forced to make strict budget cuts in 2021 and beyond. Take Utah, which collects more than $1 billion in revenue from travel and tourist spending each year. Visits to national and state parks nosedived as the country shut down. Every convention booked for 2020 in Salt Lake City was cancelled over the course of one week in March. 65,000 Utah hospitality workers were laid off in April. Salt Lake City alone lost $221,104,425 in hotel room bookings, according to a deck sent to me by an industry professional. Although the state has partially reopened, Salt Lake will be lucky if a single convention is held in the first half of 2021. Contracts are not being signed, and at least one group scheduled for October 2021 has already cancelled.
It’s difficult to assemble state-level revenue data if you don’t, say, know someone who works in the hospitality industry in Utah. Forty-nine states and DC have released data about their budget shortfalls, but none are open about the reasons we can’t roll back reopening in the wake of significant case spikes. Stay-at-home orders were effective at slowing the spread of the virus not only because of the legal force they carried, but also because, it turns out, people still take cues from government and community leaders. In a recent update on DC’s finances, Bowser stressed that progress on DC’s reopening metrics would be the key to making sure workers and consumers felt “confident” returning to normal. Actual safety remains an unrealistic goal.
Bowser’s office recently responded to the FOIA requests I submitted in June. The records produced clearly showed that her communications staff directed the Office of the Chief Technology Officer to delete and conceal public Covid-19 data in the lead-up to reopening. I sent the records to local journalists, who quickly reported on them (one asked why I’d filed FOIAs and the only explanation I could manage was the truth: “I became very obsessed”). When questioned about this reporting, Bowser did not deny that she had removed data or reopened without meeting the metrics. She just said “that’s not news.”
Nonetheless, six days after I shared my FOIA responses, DC announced it was retiring the community spread metric. DC Health Director Dr. Laquandra Nesbitt said that the public had misunderstood the data, and that it would be replaced by clearer metrics. When DC posted a new dashboard, it looked like I had won an important battle — until I noticed that the new display is merely a static image and the accompanying charts show far less data than previous iterations, making it nearly impossible to catch any future edits or deletions. Some of the information on the new dashboard is baffling: DC has only 702,445 residents, but the city reports the number of tests performed per one million residents. A quick glance at the dashboard implies an average of 4,746 tests were performed daily in the last week of September. The actual average number of tests was only 3,334.
The contact tracing data is more concerning. The dashboard has reported that the city attempted to contact more than 97 percent of the “close contacts” of those with positive tests within two days of the result every day for the last two months. This contact tracing is vital to containing the virus, because it allows potentially infectious people to quarantine before exposing others. However, DC recently disclosed that it actually includes all calls to close contacts in the metric, even if they were made outside of the two-day “ideal contact window.” In other words, the chart that purports to show calls made within two days actually shows calls made at literally any time. To learn this, you only have to scroll past six charts and download a PDF.
The new dashboard also retroactively adjusts nearly every Phase 2 reopening metric DC used, calibrating goals to ensure that DC’s old data met each one. The ideal transmission rate of “less than one” suddenly became “less than 1.2,” the cap for hospital occupancy was raised from 80 percent to 90 percent, and the number of people with positive test results that had to be called by contact tracers within a day was lowered from 90 percent to 80 percent.
I’ve filed more FOIAs, but I don’t expect any further proof of data manipulation will be the nail in the coffin for DC’s reopening. Only two states, California and New Mexico, have reissued stay-at-home orders in response to nationwide post-reopening case surges. Rather than reinstating any of DC’s restrictions, Bowser is moving forward, pushing for in-person instruction at schools and approving a rooftop nightclub at the Kennedy Center.
I remain at home in Petworth. At this point, I’m not sure I’ll ever be confident it’s safe to leave.
Allison Hrabar is a tenant organizer and student in Washington D.C.
THIS ARTICLE APPEARS IN ISSUE 2 OF THE DRIFT. TO SUPPORT OUR WORK, SUBSCRIBE OR MAKE A TAX-DEDUCTIBLE DONATION. TO RECEIVE OUR LATEST CONTENT, SIGN UP FOR OUR EMAIL LIST.
You have read all of your free articles.
Subscribe for unlimited access.
You have read all of your free articles.
Already a subscriber? Sign in.
Subscribe for unlimited access.
SubscribeAlready a subscriber? Sign in.
×
You have access to The Drift thanks to your library. Subscribe to receive a year of issues in print.
You have access to The Drift thanks to your library.
Support new writers and get a year of print issues. Subscribe